In this article
- GRP, net reach, and why the distinction matters
- Budget-neutral is not GRP-neutral
- The two graphs that explain how reach is built
- The frequency distribution
- The reach build curve
- Why identical GRPs can produce very different reach
- What transfers to digital, and what does not
- What a plan that delivers its promised GRPs has and has not done
- Frequently asked questions
A gross rating point is one percent of a defined target audience reached by one advertising insertion. Add those percentages across every insertion in a campaign and you have gross rating points: a running total of contacts, not a count of distinct people. The same person counted three times contributes three points. That is precisely what the word gross signals, and confusing it with net reach is the most common error when reading a media plan.
If you are here because you needed that definition, you have it. What follows explains why the number of GRPs a campaign accumulates tells you far less than it appears to, and what to look at instead.
GRP, net reach, and why the distinction matters
A media plan that promises 300 GRPs has told you that the sum of all audience percentages, across all insertions, equals 300. How many distinct people were reached, how often each of them saw the campaign, or whether anyone received it the number of times your strategy requires, none of that is answered.
Net reach is the count of unique individuals. It is expressed as 1+ reach (at least one contact), 2+ reach, 3+ reach, and so on. The frequency threshold at which reach becomes strategically useful depends on the objective. An awareness campaign may be satisfied with a single contact. A persuasion campaign typically requires more before the message registers.
GRPs and net reach are related but not interchangeable. Two hundred points spread across many insertions with little audience overlap can produce a wide but shallow reach curve. The same two hundred points stacked on heavily overlapping audiences can produce a narrow but deep one. The gross total is identical. The campaign is not.
Budget-neutral is not GRP-neutral
The price of a rating point is not fixed. It varies by daypart, by programme environment, by season, and by the terms of the deal negotiated with a channel or sales house. Move the same budget in a different direction, across different breaks or different periods, and you will produce a different number of points. Budget-neutral planning is therefore not GRP-neutral planning, and GRP-neutral planning is not reach-neutral planning. Each step in that chain is a separate variable.
This matters when a plan is reviewed after delivery. A shortfall in GRPs may reflect a shift in pricing rather than a reduction in effort. A surplus may disguise a concentration in cheaper, lower-quality inventory. Volume alone does not tell you which.
The two graphs that explain how reach is built
There are two ways to look at how a campaign assembles its audience. Together they carry most of what needs to be understood about reach building.
The frequency distribution
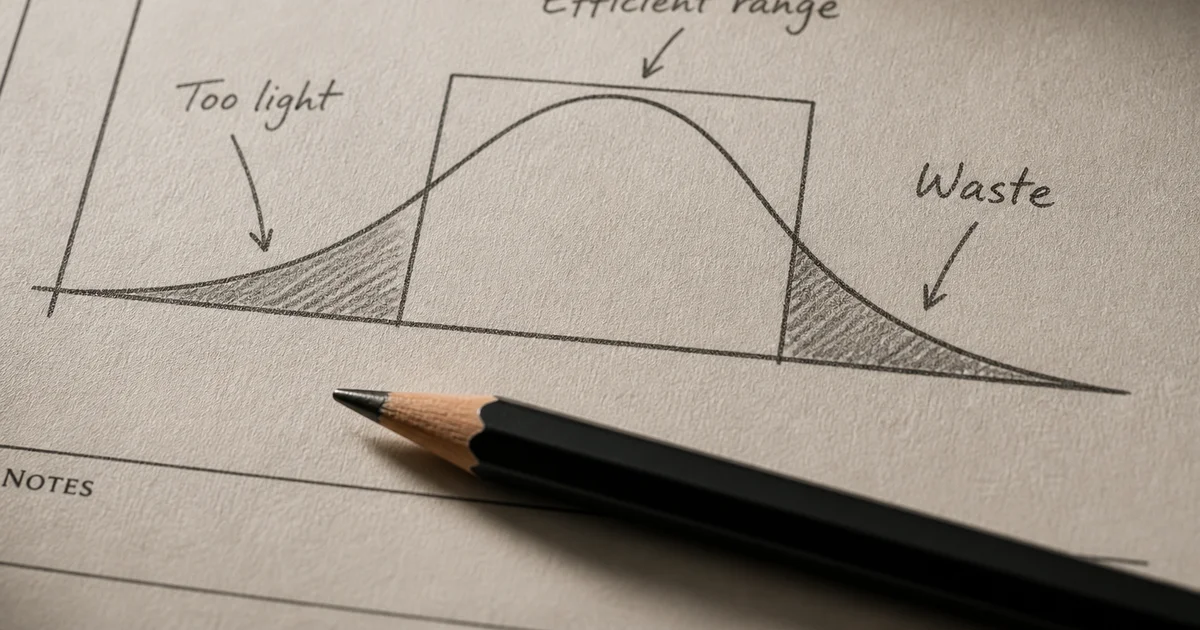
Draw contact classes along the horizontal axis, from zero contacts on the left to high frequency on the right. Draw net reach along the vertical axis. The result is a frequency distribution: it shows how many people in the target audience saw the campaign zero times, once, twice, three times, and so on.
If the strategic objective is to reach half the target audience at three or more contacts, the ideal shape of that distribution is a rectangle. Everyone who sees the campaign at all sees it three times; nobody sees it more.
Real distributions are curves. Everything to the left of the threshold represents reach that was built but did not meet the frequency objective: those people were reached, and that costs rating points, but the contact was insufficient. Everything to the right of the objective represents contacts beyond what the strategy asked for. Those people were reached more times than necessary, at the cost of rating points that could have built reach elsewhere. Both tails are made of GRPs, and every GRP costs money. Shaping the distribution so that the curve sits as close to the rectangle as the market and the available inventory allow is what a plan is for.
The reach build curve
Draw GRPs along the horizontal axis and net reach along the vertical. The curve rises steeply at first and then flattens into a long tail. Each additional rating point buys less unique reach than the one before it, because the people most easily reached have already been reached. That is the law of diminishing returns in media, and it applies separately to 1+, 2+, and 3+ reach: higher frequency thresholds cost progressively more points per additional percentage point of reach.
There is a point at which the next unit of reach costs more than the objective warrants. Knowing roughly where that point sits is part of assessing whether a plan is well constructed. The same reach build can be drawn for different combinations of breaks and programmes, which makes the composition of the plan an optimisation variable in its own right, not merely the volume purchased.
Why identical GRPs can produce very different reach
Consider this illustration. One hundred GRPs assembled as a thousand insertions, each scoring a tenth of a rating point, stacks small and heavily overlapping audiences. The same viewers return repeatedly across lightly watched programming. One hundred GRPs assembled as ten insertions, each scoring ten rating points, reaches a large audience each time, with less overlap between insertions. The gross volume is identical. The net reach is not: the first construction can leave 1+ reach at a fraction of what the second achieves, because most of its contacts land on people already reached.
Television is negotiated at channel or sales-house level and, depending on the deal, optimised at break and position level. Viewers choose programmes rather than channels. Which programmes a plan touches, and how far their audiences overlap, determines how much unique reach is built. A break bought cheaply that adds no reach the plan did not already have is not cheap. It is waste, expressed in cost-per-point terms.
Attention is also not captured in any of these measures. Different programming environments produce different levels of attention and recall, and none of that appears in a rating point. It is a limitation of the currency, worth noting rather than ignoring.
What transfers to digital, and what does not
The logic of GRPs, frequency distributions, and diminishing returns transfers completely to digital media. The two tails exist, the reach build flattens with scale, and higher frequency thresholds cost progressively more. What does not transfer is the measurement.
There is no common currency across digital platforms. Each platform counts its own delivery in its own terms, which means adding those figures together adds up different things, not a consolidated campaign total. Television measures viewing; digital largely measures delivery and models reach from it. Whether a figure is measured or modelled is rarely stated and should be.
The frequency distribution, which is the instrument the whole argument rests on, exists per platform in digital. Building one across platforms requires person-level data that the major platforms do not share with one another. In practice this means: measured where a single measurement party covers several platforms at once, modelled where it does not, and assessed per platform where even that is unavailable. Which part of a campaign falls into which category is itself worth stating in the reporting. A conclusion about a whole campaign is then a judgement built on its parts rather than a sum of them, and that distinction is worth making explicit.
The threshold itself is expressed differently by medium. Television counts contacts; digital objectives are often set in completed views, viewable impressions, or attention seconds. The rectangle logic holds, but the horizontal axis is not the same unit across media. What counts has to be fixed before the campaign runs, or the distributions are not comparable.
What a plan that delivers its promised GRPs has and has not done
A plan that delivers the promised volume of rating points has demonstrated that it ran. It has not demonstrated that it met its reach objective, because only the frequency distribution shows whether the contacts were distributed in the way the strategy required. This is the practical consequence of everything above, and it is where media measurement and mileage begins: the question is not whether the points were delivered but whether the delivery was shaped correctly.
How close a plan can come to the ideal frequency distribution cannot be stated in general. It depends on the objective, on what is available in that specific market, and on the deal. It can only be judged against experience of what comparable plans in comparable conditions achieve.
For a closer look at what different viewing contexts mean for how reach is counted across media, the differences between how six media count a view clarifies why the horizontal axis is never the same unit twice. And if the question behind this one is whether the budget is generating the gross rating points it should, that is the territory of how much mileage a media budget delivers.
Frequently asked questions
What is a gross rating point? A gross rating point is one percent of a defined target audience reached by one advertising insertion. Gross rating points are the sum of those percentages across all insertions in a campaign. Because the same person counts every time they are reached, GRPs measure contacts, not unique individuals.
What is the difference between GRPs and reach? GRPs are a gross measure: they add up every contact, including repeated contacts with the same person. Net reach counts unique individuals and is expressed as the proportion of the target audience reached at least once, twice, three times, or more. Two campaigns with identical GRPs can produce very different net reach depending on how the contacts were distributed.
What is effective reach? Effective reach is the proportion of the target audience reached at or above the frequency threshold the strategy requires. Where net reach counts everyone reached at least once, effective reach counts only those reached often enough for the campaign to do its work. Two plans with identical net reach can differ substantially in effective reach, depending on how the contacts are distributed.
Why do two campaigns with the same GRPs perform differently? Because the composition of the plan determines how much of the gross volume translates into unique reach. One hundred GRPs assembled from a thousand small insertions, each reaching a tenth of a percent, stacks heavily overlapping audiences. One hundred GRPs from ten large insertions, each reaching ten percent, reaches a large audience each time with far less overlap. The gross total is the same; the net reach is not.
Does this apply to digital media? The logic applies completely. Frequency distributions exist, diminishing returns apply, and higher frequency thresholds cost progressively more points per additional percentage point of reach. The measurement does not transfer directly: each platform counts in its own terms, delivery is not the same as viewing, and a consolidated frequency distribution across platforms requires person-level data that the major platforms do not share. In practice it is measured where a single party covers multiple platforms, modelled where it does not, and assessed per platform where neither is available.
What is the law of diminishing returns in media? As a campaign accumulates rating points, each additional point buys less unique reach than the one before it, because the most accessible members of the target audience have already been reached. The reach build curve rises steeply at first and then flattens. This applies separately to each frequency threshold: reaching half the target audience at three or more contacts requires progressively more rating points than reaching it at two or one, and there is a point beyond which the cost of the next percentage of reach exceeds what the objective warrants.